Using Regulatory Reports
The Regulatory Reports service in Automated Back Office allows you to perform the following tasks on auto-generated reports:
-
Accessing your Reports — browse or search for your report.
-
Viewing Scheme Reports — view the contents of the auto-generated report. You can also compare the data in your report to a previous quarter's submission, and preview a report.
-
Editing a Report — make any required changes to a report, including adding any missing data.
-
Exporting Report Data — export the report data in your list of reports to external systems.
Clients should review and edit the sections in the reports that are relevant to their own reporting requirements.
Accessing your Reports
About the Report Columns
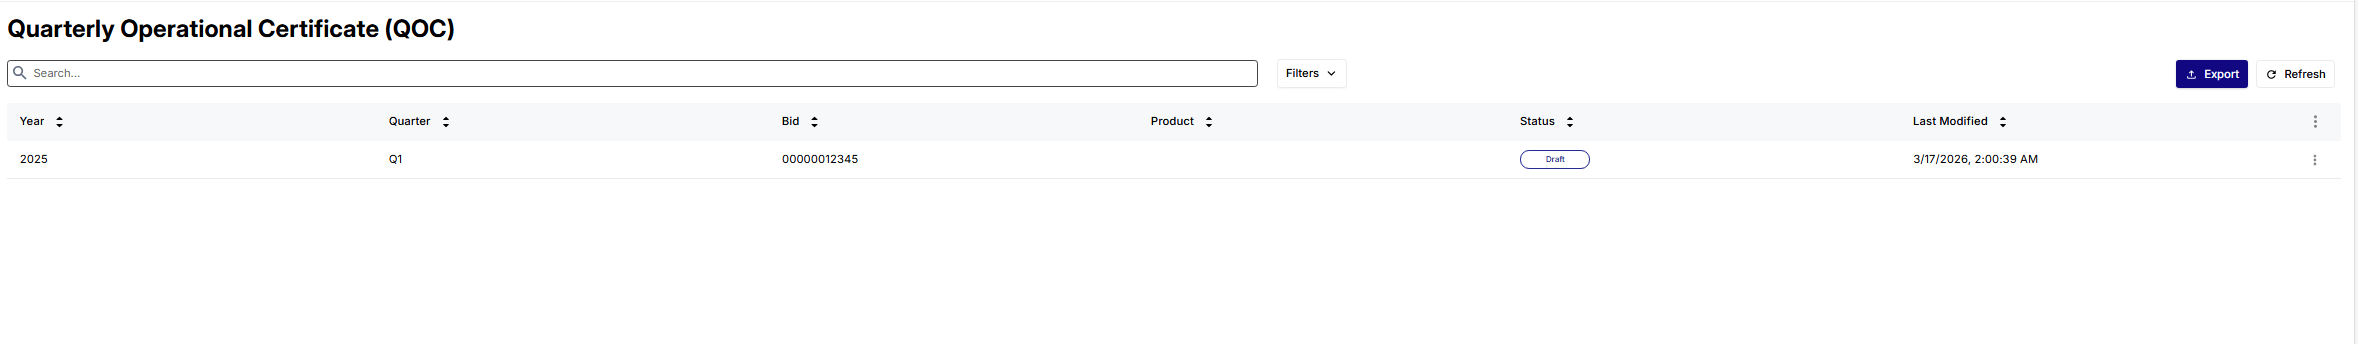
By default, the reporting screen displays columns from the QOC and QMR. This allows you to identify your report data.
For the QOC, the following columns appear:
- Year
- Quarter
- Bid
- Last Modified
- Product
- Status
For QMR, the following columns appear:
- Year
- Quarter
- Ica
- Bin
- Product
- Status
- Last Modified
The QMR can be set at Interbank Card Association (ICA) and BIN level. When set at the ICA level, the BIN is empty.
Adding Report Columns
You can add more columns to the screen over the default display of columns. As you add extra columns, the horizontal scrollbar appears.
- Ensure that you have opened a QMR/QOC in the report screen.
- Click the
 button in the heading row.
 - Select any of the required check boxes.
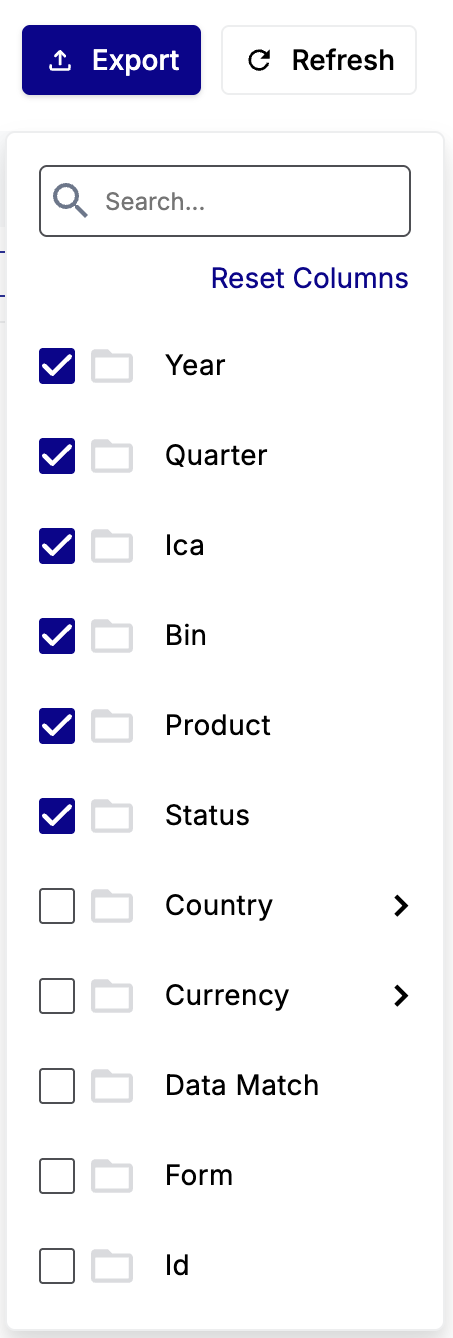
For a QOC, these can include Country, Currency, Data Match, Form, Id, Last Modified, Processor, Program id, Region, and Spid.
For a QMR report, these can include Bid, Country, Currency, Id, Last Modified, Processor, Program id, Region, and Spid.
Viewing Report Details
You can click a row to view details of the regulatory report.
Browsing between Pages
You can use the arrows at the bottom of the page (next to the page numbers) for browsing between pages.

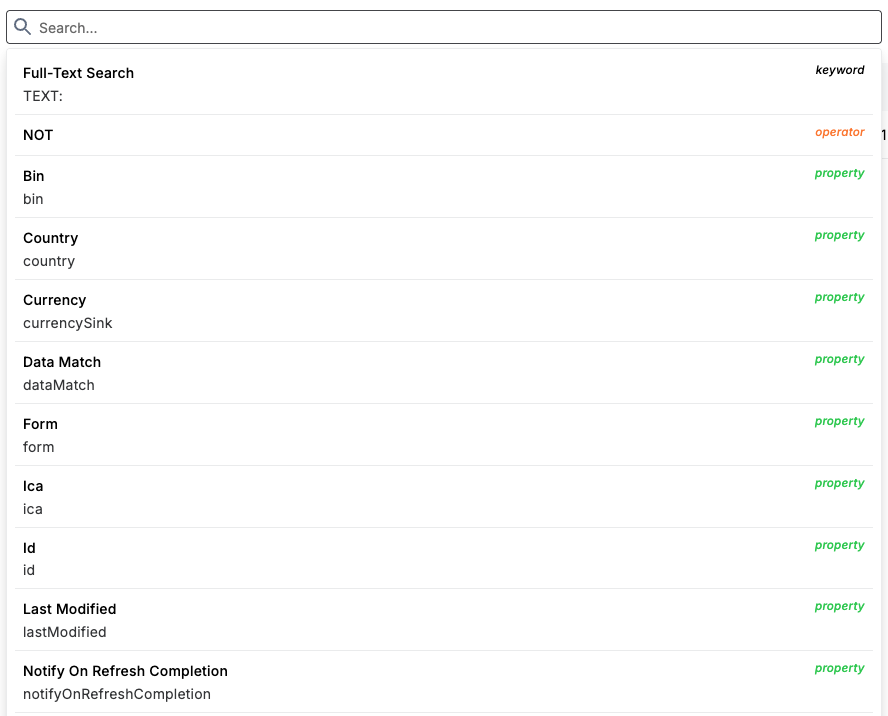
Searching for a Report
You can enter a search term in the search box. Or you can click on the search box and use the various properties that appear in a drop-down list.
Filtering Records
You can use the Year, Quarter and Status filter options to refine the list of records.
Choosing the Default Filter Options
To choose the default filter options:
-
Click the Filter button. Drop-down lists appear for all the filters.
-
Select individual filter options from the drop-down lists or use the search:
-
Year: All
-
Quarter: All
-
Status: All
-
Filtering by Year
To filter by year:
-
Click the Year: All drop-down list. A pop-up menu appears.
-
Select any of the following Boolean options from the list.
-
Equal
-
Not Equal
-
Greater than
-
Less than
-
Greater than or equal
-
Less than or equal
-
Between (exclusive)
-
Between (inclusive)
Filtering by Quarter
To filter by quarter:
-
Click the Quarter: All drop-down list. A pop-up menu appears.
-
Select any of the following Boolean options from the list or use the search.
-
Q1
-
Q2
-
Q3
-
Q4
Filtering by Reporting Status
In the Matching Status: All drop-down, select a reconciliation status from the list of either Draft, Submitted or WARNING or use the search.
Choosing Further Filter Options
To select further filter options:
-
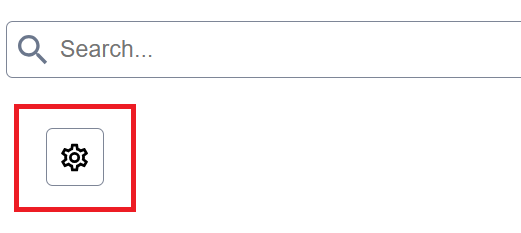
Click Filter. The gears icon appears with the other filter options.
-
Click the gears icon.
-
Select any of the filter option categories. These include:
-
Id
-
Spid
-
Region
-
Form
-
Product
-
Bin
-
Ica
-
Country
-
Currency
-
Program iD
-
Refresh In Progress
-
Last Modified
-
-
Exporting Report Data
You can export your report data outside of Automated Back Office. For example, you can provide these reports for a developer.
Export to CSV
If you selected the CSV option, you can include the date format. You can also select the option for exporting all the columns that exist for a file, and not just those that appear in the Collections view.
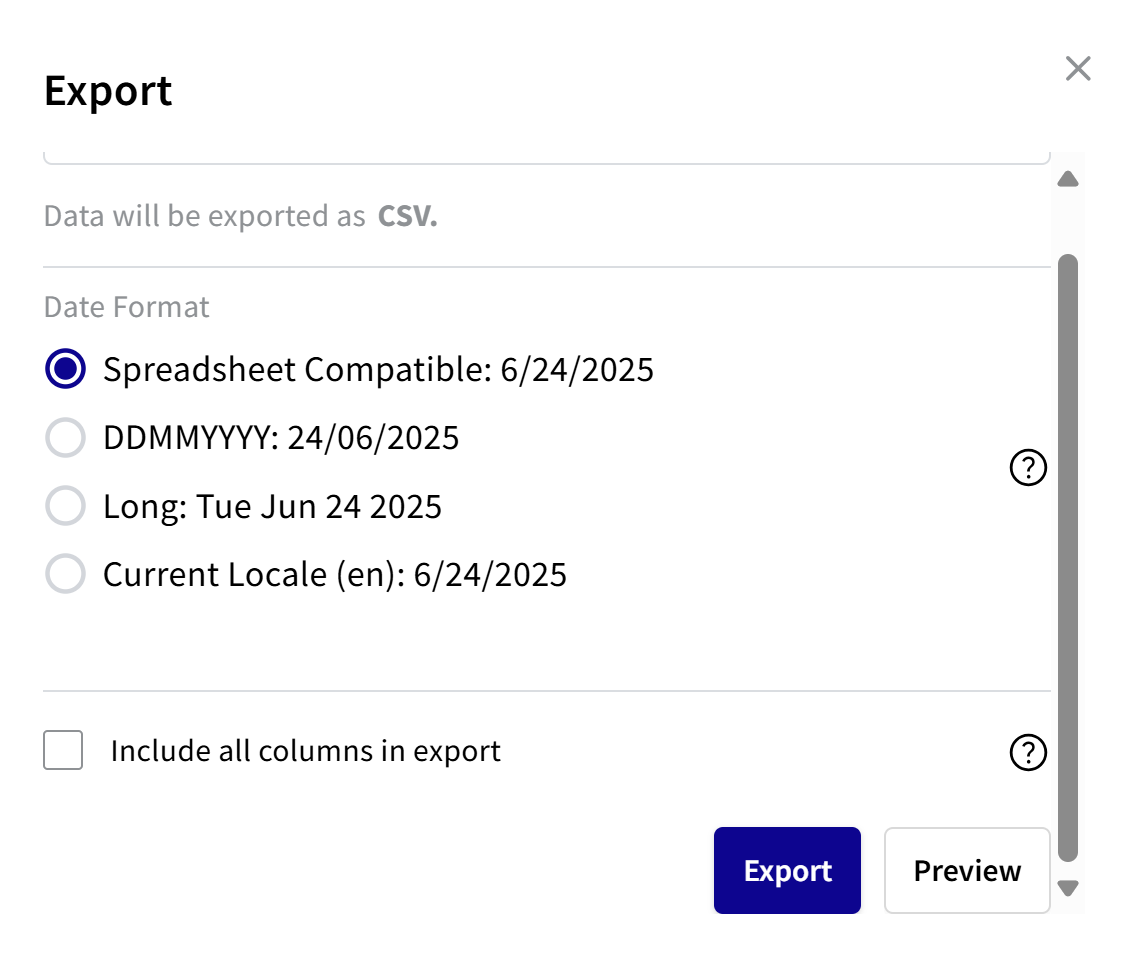
To export to CSV:
- Choose a date format:
- For spreadsheet compatible, select Spreadsheet Compatible. See second note.
- For DDMMYYYY, select DDMMYYYY.
- For a long date format, select Long.
- For current locale, select Current Locale.
- To export all the columns in the file, select the Include all columns in export check box.
If you do not select the check box, you only export those columns that appear in the Collections view.
- To preview, click Preview. The Response box shows how the date appears in the CSV file.
- To export, click Export.
Export to JSON
If you selected the JSON export option, you can preview the export data.
- To preview the data, click Preview. The JSON response appears.
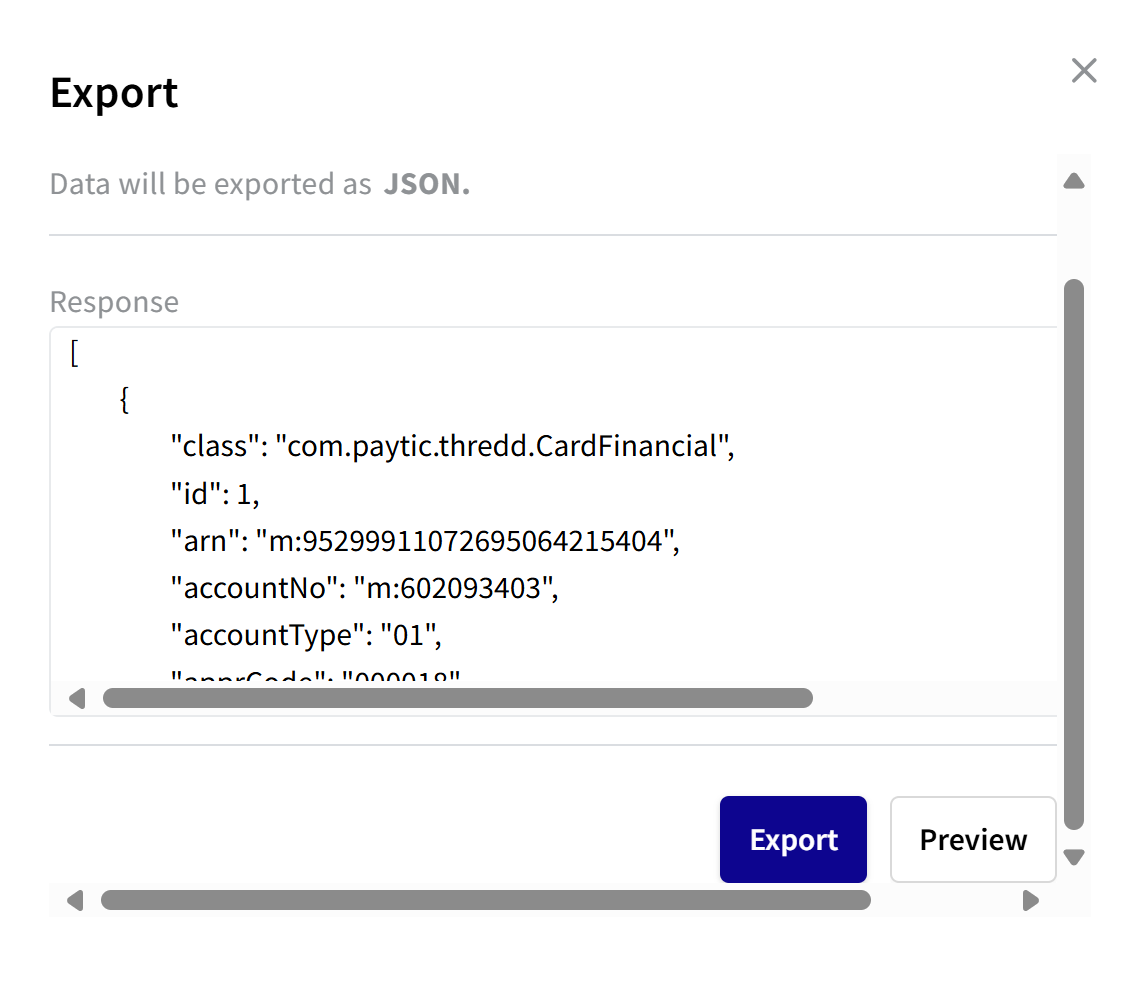
- To export, click Export.
Export to XML
If you selected the XML export option, you can preview the export data. Or, you can just export the data.
- To preview the data, click Preview. The Response box shows the report in XML format.
- To export, click Export.